
Cryptocurrencies are some of the most volatile assets on the market.
We can blame US SEC inaction for most of that. However, we can still make consistent money from cryptocurrency by watching four key technical indicators. In fact, when these four indicators align, Bitcoin for example reverses course up to 80% of the time.
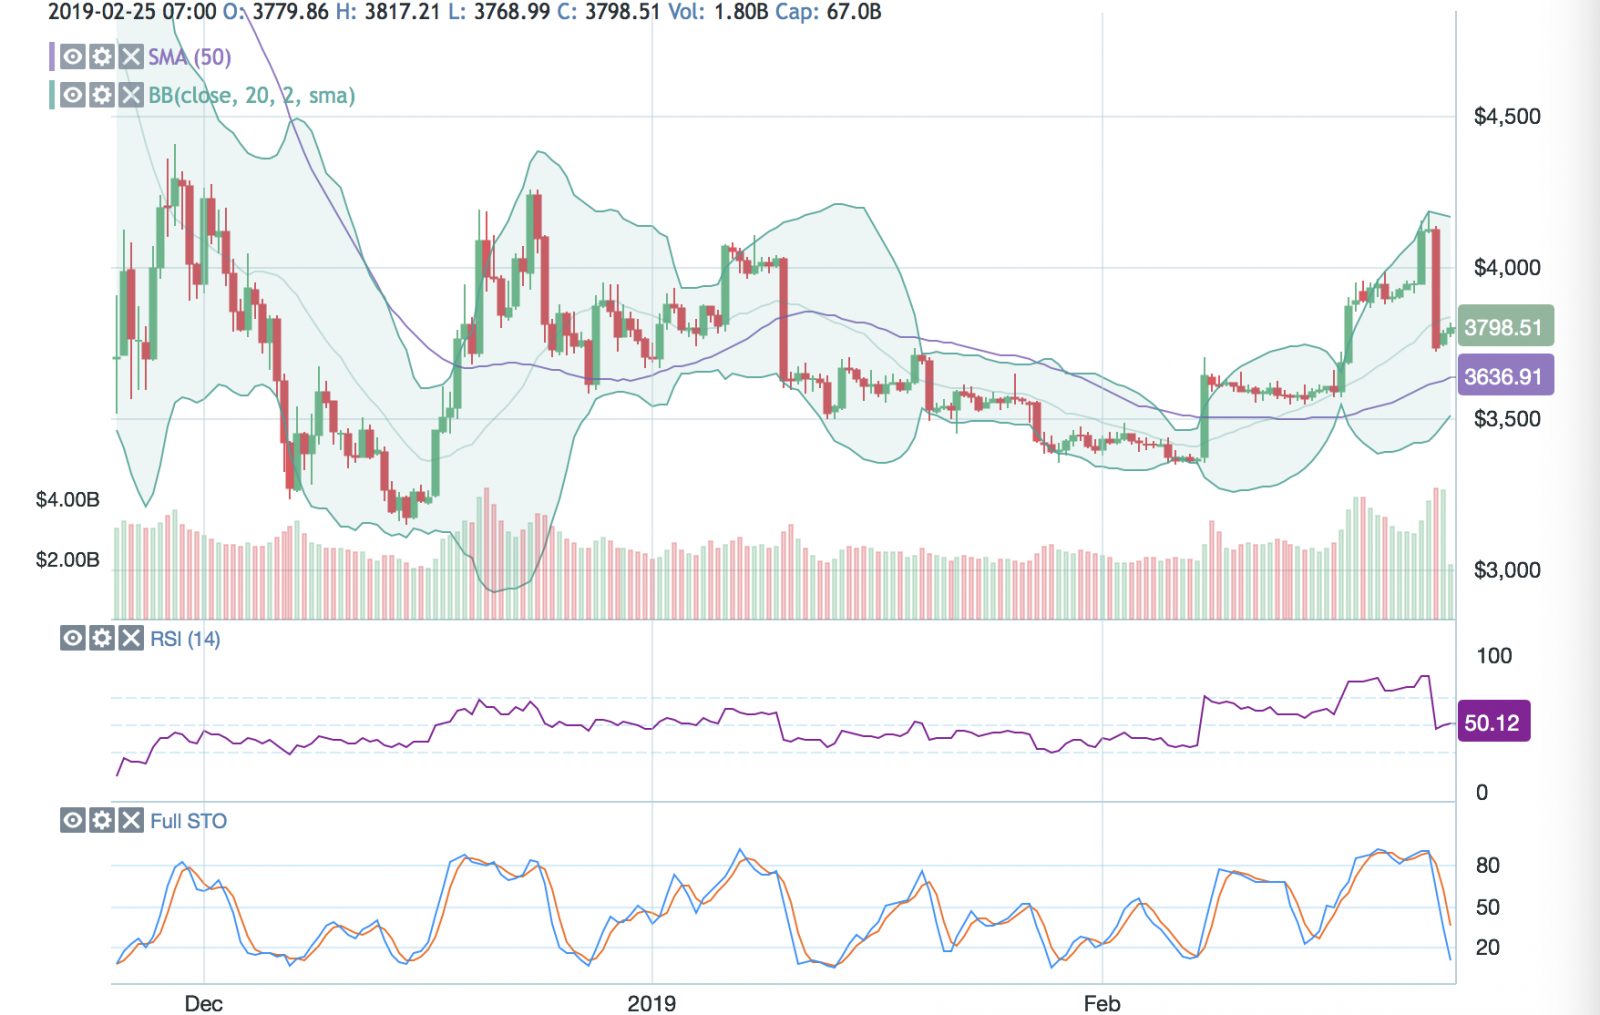
All we need are Bollinger Bands (2,20), relative strength (RSI), and Full Stochastics.
Learn How to Spot Unique and Predictable Patterns in Cryptos
Indicator No. 1 — Relative Strength Index (RSI)
The Relative Strength Index (RSI) acts as a momentum indicator which helps measure the value of the latest price changes. It helps us determine if a coin or even a stock is oversold or overbought by watching its range between 30 and 70. For example, historically, each time Bitcoin has hit or penetrated its 20-line on RSI, we typically see a bounce back in the coin.
As you can see in the BTC chart, each time that has happened, it’s been another opportunity to either buy more or sell at the high. However, we never want to rely on just one indicator. So, we begin to look at the Bollinger Bands (2,20), as well.
Indicator No. 2 — Bollinger Bands (2,20)
Bollinger Bands (2,20) let us know how far a coin price can be stretched before it begins to pullback and revert to mean. The idea behind these bands is simple. When a stock – or index – touches or penetrates the lower band, the situation can be considered oversold. When a stock touches or penetrates the upper band, it can be considered overbought.
Look at what happens when RSI is at or below its 30-line, and BTC is at its lower Band. Up to 80% of the time, we see a pivot higher. Now look at what happens when RSI is at or above its 70-line, and BTC is at its upper Band. Again, up to 80% of the time, it pivots.
To be safe, we can confirm again with Full Stochastics.
Indicator No. 3 – Full Stochastics
As you can see in the chart, there are a considerable number of ups and down on Full STO. With this indicator, when it gets to or above its 80-line, BTC is considered overbought. If BTC is at its upper Band, and RSI is over-extended at the same time, we see a pivot. The same holds true when Full STO has fallen to or below its 20-line.
Cryptocurrencies will remain volatile until the US SEC wakes up.
However, we can still profit from them simply by paying attention to three key indicators.
Free Bonus Report: There are several patterns that can pintpoint the likely price movement of cryptos. Click Here to get the full report on how to spot these patterns.