When Munehia Homma created candlestick charting in the 1700s, he created it for the rice trade.
He would record the opening day’s price of rice, the low and the close. Over time, it would offer him a glimpse of price patterns, allowing him to map repetitive signals in the price bars.
He even named them, using names such as spinning tops, dojis, and hanging man. The discovery of such patterns helped him predict the future direction of rice prices, giving him a significant advantage over other traders.
To this day, we still use some of those same candlesticks to predict potential repetitive moves in stocks, indices, ETFs, and even cryptocurrencies. In fact, some of the most well-known include:
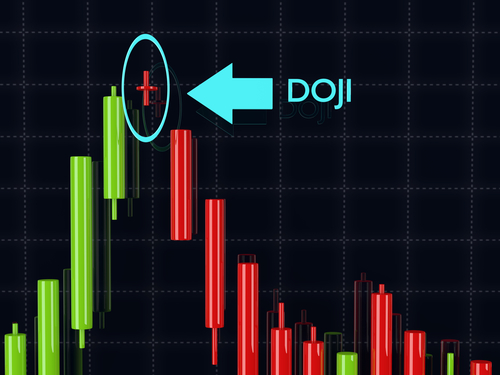
No. 1 – The Doji Cross
Doji crosses are a sign of indecision of bulls and bears. When found at the top or bottom of trend, it can indicate that a reversal in the other direction may be nearing. However, as with any technical indicator, confirmation is key. Typically, when we see a doji at top or bottom of trend, it can be a sign of indecision among the bulls and bears.
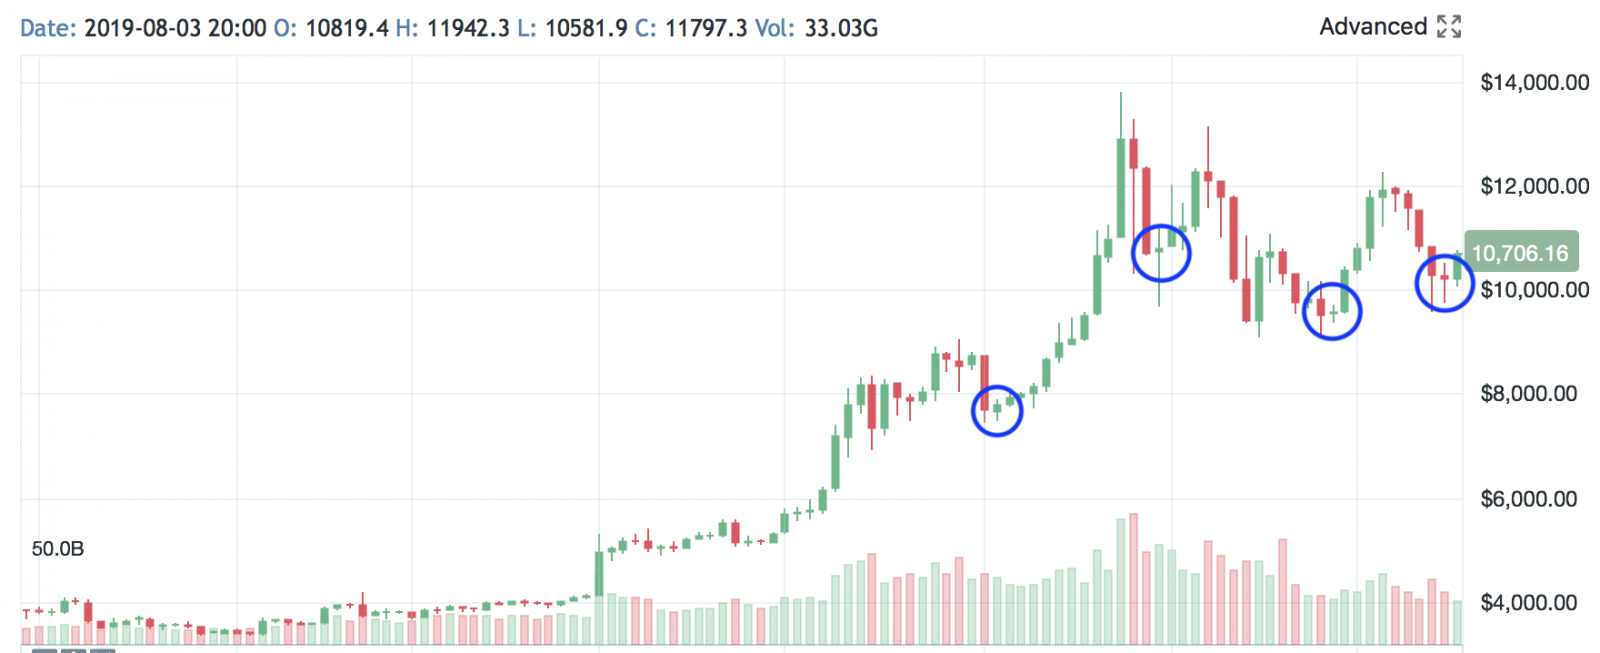
We can see a few of these crosses at bottom of trend, for example, which eventually gave way to a change of direction in Bitcoin (BTC).
Must Watch Video: Legendary trader Rob Booker uses his profits from a trade to “Tip the Shiz” out of a worker at a Burger Joint.
Click Here to watch.
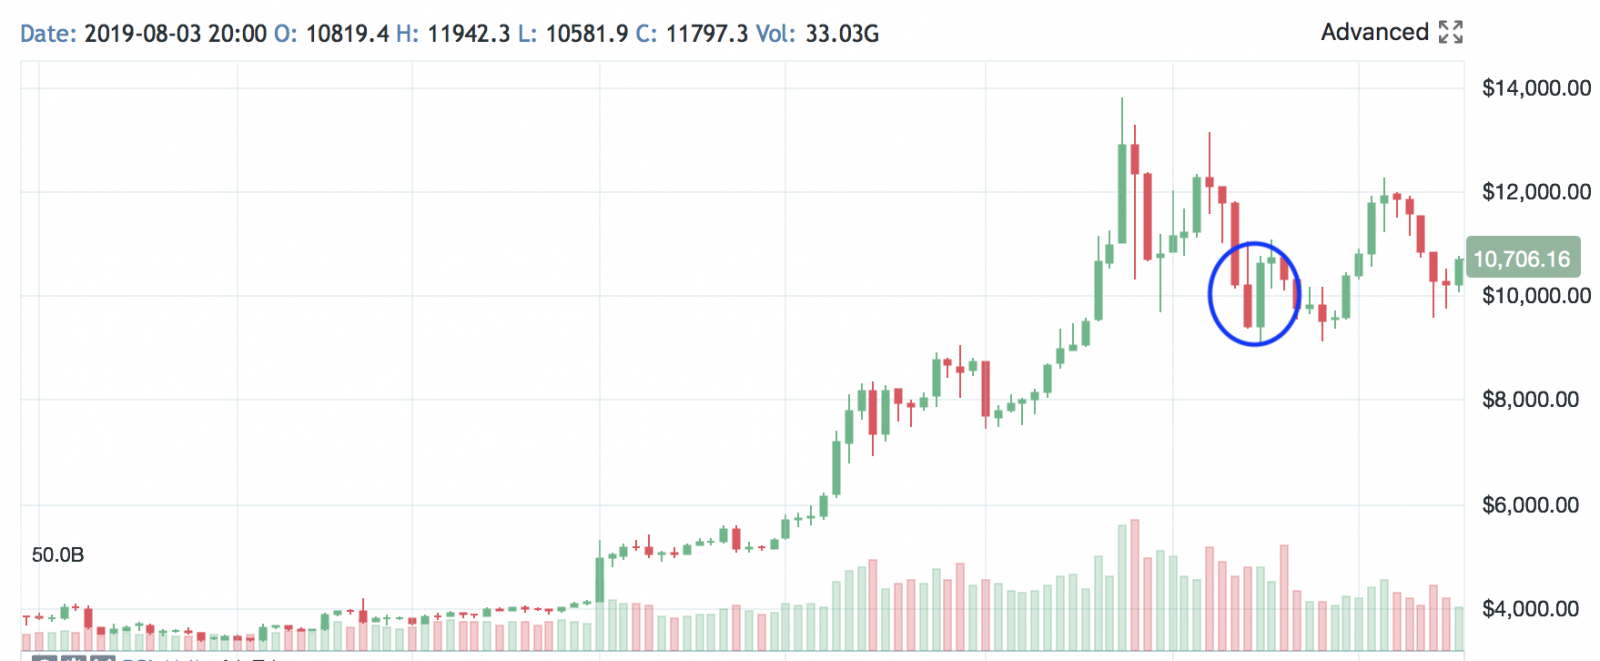
No. 2 – The Bullish Engulfing Candle
This one forms when a large white (or in this case, green) candlestick appears next to a smaller red or black candlestick, engulfing it. What that suggests is that the bulls have now taken control of the stock price from the bears. The pattern will follow a stock price decline, and indicate potential reversal off a low. We can again see this in a chart of Bitcoin (BTC).
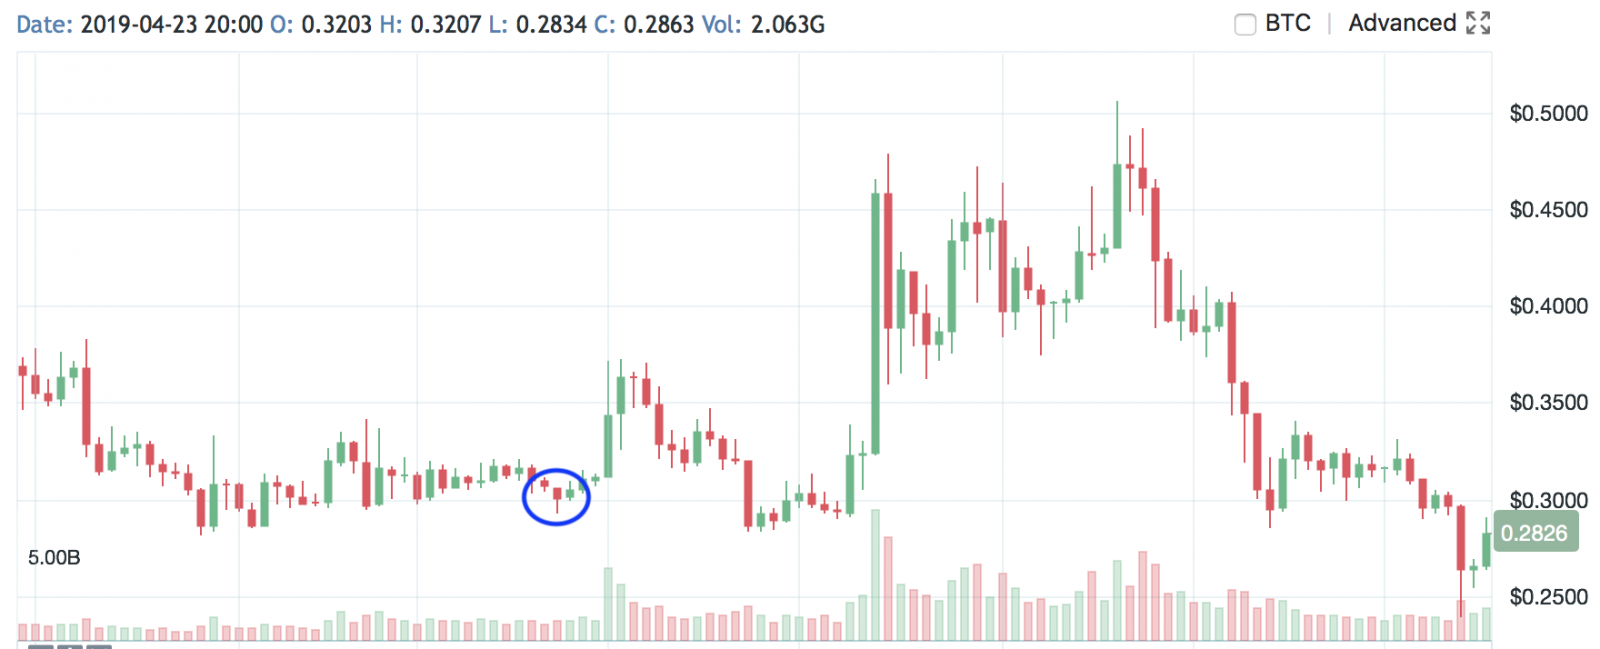
No. 3 – The Hammer Candlestick
There’s also a hammer candlestick, which when found at bottom of trend, can indicate exhaustion of the bears and likely upside. It’s a signal of capitulation among the sellers and an indication of potential trend change.
The signal doesn’t always mean that bullish investors have taken control of a stock, but it does mean that sellers are exhausted and buyers are waking back up. These are most effective when they follow three or more consecutive declining days on trading.
We can see on in this chart of Ripple (XRP) for example after a very brief pullback.
While news flow greatly impacts the direction of cryptocurrency, technical analysis – which includes the use of candlesticks – can help dictate the next hot setup.
Burger Restaurant Employees Get Huge Tip from Legendary Trader
Click Here to Watch.