
Without a doubt, cryptocurrencies have become one of the most volatile trades on the market.
While there’s considerable institutional support for digital currency, and even some support from U.S. SEC Crypto Mom, Hester Peirce, there have been plenty of hiccups along the way. Congress has been holding up Facebook’s Libra, for example.
However, despite all of the chaos, there’s still a proven way to spot opportunity.
In fact, up to 80% of the time, three key pivot points have shown us exactly when to buy on extreme bearishness, and exit on extreme bullishness.
Learn How to Spot Unique and Predictable Patterns in Cryptos
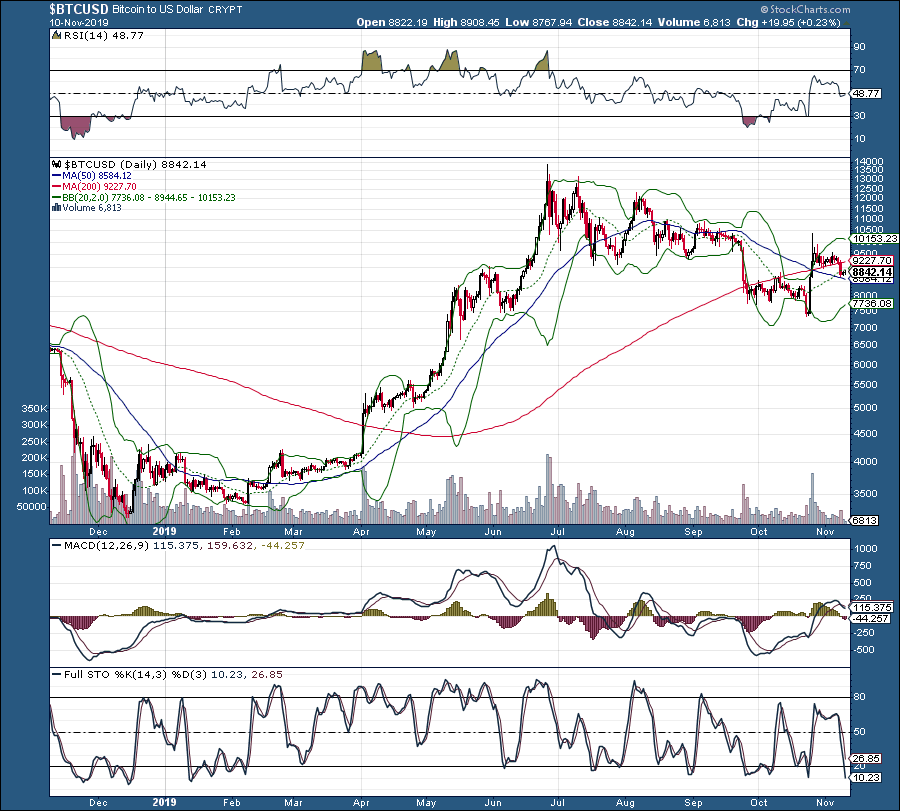
Indicator No. 1 — Relative Strength Index (RSI)
The Relative Strength Index (RSI) acts as a momentum indicator which helps measure the value of the latest price changes. It helps us determine if a coin or even a stock is oversold or overbought by watching its range between 30 and 70. For example, historically, each time ETH has hit or penetrated its 20-line on RSI, we typically see a bounce back in the coin.
Indicator No. 2 — Bollinger Bands (2,20)
Bollinger Bands (2,20) let us know how far a coin price can be stretched before it begins to pullback and revert to mean. The idea behind these bands is simple. When a stock – or index – touches or penetrates the lower band, the situation can be considered oversold. When a stock touches or penetrates the upper band, it can be considered overbought.
Look at what happens when RSI is at or below its 30-line, and ETH is at its lower Band. Up to 80% of the time, we see a pivot higher. Now look at what happens when RSI is at or above its 70-line, and ETH is at its upper Band. Again, up to 80% of the time, it pivots.
We can confirm even more with Full Stochastics.
Indicator No. 3 – Full Stochastics
As you can see in the chart, there are a considerable number of ups and down on Full STO. With this indicator, when it gets to or above its 80-line, ETH is considered overbought. If ETH is at its upper Band, and RSI is over-extended at the same time, we see a pivot. The same holds true when Full STO has fallen to or below its 20-line.
While technical analysis won’t give you perfection, these indicators are well worth paying attention to. After all, they do have a history of up to 80% success.
Free Bonus Report: There are several patterns that can pinpoint the likely price movement of cryptos.
Click Here to get the full report on how to spot these patterns.